


Advanced Technical Analysis Techniques
How it can add to your investing tool kit

Technical analysis is a vital tool for investors seeking to make informed decisions based on market data. While basic techniques like moving averages and support/resistance levels are widely used, advanced technical analysis can provide deeper insights and more precise trading signals. This blog explores advanced techniques such as Elliott Wave Theory, Fibonacci retracements, and complex chart patterns, offering retail investors powerful strategies to enhance their trading performance.

I. Elliott Wave Theory
Concept and Explanation: Elliott Wave Theory, developed by Ralph Nelson Elliott, is based on the idea that financial markets move in predictable patterns or waves influenced by investor psychology. The theory suggests that prices move in a series of five upward (impulse) waves followed by three downward (corrective) waves.
Key Components:
Impulse Waves (1-5): The primary trend direction, consisting of five waves.
Corrective Waves (A-C): The counter-trend direction, consisting of three waves.
Rules and Guidelines:
Wave 2 never retraces more than 100% of Wave 1.
Wave 3 is typically the longest and never the shortest of the impulse waves.
Wave 4 does not overlap with the price territory of Wave 1.
Application: Traders use Elliott Wave Theory to identify the overall market trend and anticipate future price movements. By recognizing the wave patterns, investors can make strategic entry and exit decisions.
Example: An investor identifies a completed five-wave impulse pattern in a stock, followed by a three-wave corrective pattern. Anticipating the start of a new impulse wave, the investor buys the stock, expecting an upward trend.
II. Fibonacci Retracements
Concept and Explanation: Fibonacci retracement levels are based on the Fibonacci sequence, a series of numbers where each number is the sum of the two preceding ones. These levels (23.6%, 38.2%, 50%, 61.8%, and 100%) are used to identify potential support and resistance levels in a price chart.
Key Levels:
23.6% Retracement: Minor pullback level, often indicating a shallow correction.
38.2% and 50% Retracements: Moderate retracement levels, commonly used to identify buying or selling opportunities.
61.8% Retracement: The "golden ratio," considered a strong support or resistance level.
Application: Traders plot Fibonacci retracement levels from a significant price high to a price low (or vice versa) to identify potential reversal points. These levels help investors determine entry and exit points, set stop-loss orders, and target prices.

Example: An investor notices a stock's price has dropped from $100 to $50. Using Fibonacci retracement, they plot levels at $61.8, $76.4, and $88.2. The stock begins to rebound, and the investor enters a position at the 61.8% retracement level, anticipating a further rise.
III. Advanced Chart Patterns
Head and Shoulders Pattern:
Description: A reversal pattern indicating a change in trend. It consists of three peaks: the middle peak (head) is higher than the two side peaks (shoulders).
Application: Traders enter a short position after the price breaks below the neckline, with a target equal to the distance from the head to the neckline.
Cup and Handle Pattern:
Description: A continuation pattern resembling a cup with a handle. The cup forms a rounded bottom, followed by a consolidation (handle) before the price continues higher.
Application: Traders enter a long position when the price breaks above the handle's resistance level, targeting the distance from the cup's bottom to the handle's breakout point.
Double Tops and Bottoms:
Description: Reversal patterns where the price tests a support or resistance level twice before reversing. A double top indicates a bearish reversal, while a double bottom suggests a bullish reversal.
Application: Traders enter a position after the price breaks below the support level (double top) or above the resistance level (double bottom), with a target equal to the pattern's height.
Example: An investor identifies a head and shoulders pattern in a stock's price chart. After the price breaks below the neckline, the investor enters a short position, targeting a price drop equal to the pattern's height.
IV. Relative Strength Index (RSI) Divergence
Concept and Explanation: The Relative Strength Index (RSI) measures the speed and change of price movements, oscillating between 0 and 100. RSI divergence occurs when the price moves in the opposite direction of the RSI, indicating a potential reversal.
Types of Divergence:
Bullish Divergence: Price makes a lower low, but RSI makes a higher low, suggesting an upward reversal.
Bearish Divergence: Price makes a higher high, but RSI makes a lower high, indicating a downward reversal.
Application: Traders use RSI divergence to identify potential reversal points and confirm trend strength. Combining RSI divergence with other technical indicators enhances trading accuracy.
Example: An investor notices a stock's price making a higher high while the RSI makes a lower high. Anticipating a bearish reversal, the investor exits their long position and considers entering a short position.
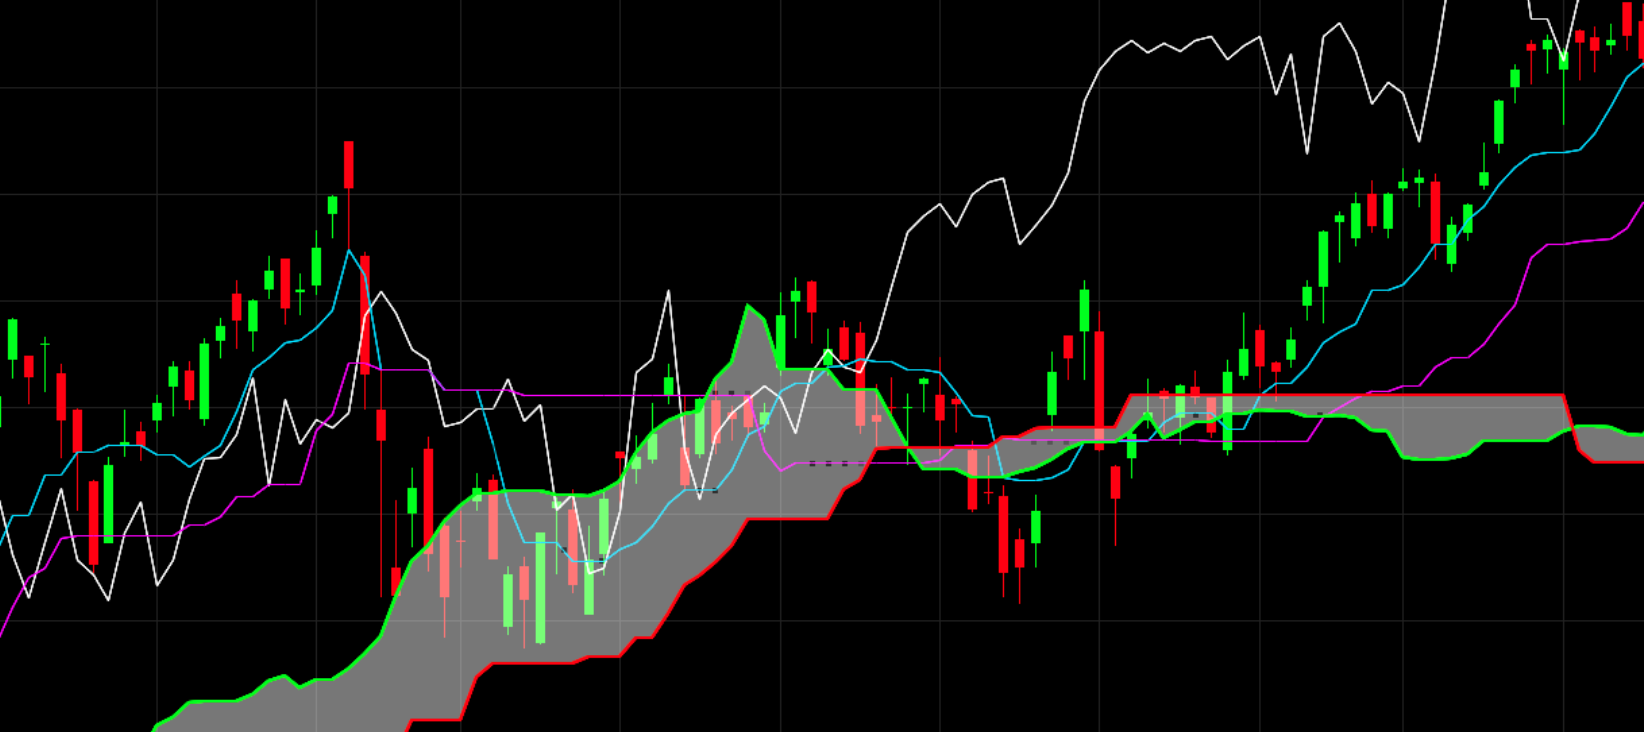
V. Ichimoku Cloud
Concept and Explanation: The Ichimoku Cloud, or Ichimoku Kinko Hyo, is a comprehensive technical indicator that provides information on trend direction, support/resistance levels, and momentum. It consists of five main components:
Tenkan-sen (Conversion Line): The average of the highest high and lowest low over the last nine periods.
Kijun-sen (Base Line): The average of the highest high and lowest low over the last 26 periods.
Senkou Span A (Leading Span A): The average of the Tenkan-sen and Kijun-sen, plotted 26 periods ahead.
Senkou Span B (Leading Span B): The average of the highest high and lowest low over the last 52 periods, plotted 26 periods ahead.
Chikou Span (Lagging Span): The current closing price plotted 26 periods behind.
Application: Traders use the Ichimoku Cloud to identify trends and potential reversal points. When the price is above the cloud, it's considered a bullish trend; when below, it's a bearish trend. The cloud itself represents support and resistance levels.
Example: An investor observes a stock trading above the Ichimoku Cloud, indicating a bullish trend. They enter a long position, using the cloud as a dynamic support level to set their stop-loss order.
VI. Risk Management and Strategy Integration
Risk Management Techniques:
Position Sizing: Allocate a small percentage of your capital to each trade to manage risk.
Stop-Loss Orders: Set stop-loss orders to limit potential losses.
Diversification: Diversify your investments across different assets and markets to spread risk.
Integrating Strategies:
Combine multiple advanced techniques to enhance trading accuracy and reduce false signals.
Use technical analysis in conjunction with fundamental analysis to gain a comprehensive understanding of the market.
Example: An investor uses Elliott Wave Theory to identify the market trend, Fibonacci retracement levels to pinpoint entry and exit points, and the RSI divergence to confirm potential reversals. By integrating these techniques, they develop a robust trading strategy.
Advanced technical analysis techniques provide retail investors with powerful tools to navigate the complexities of financial markets. By mastering Elliott Wave Theory, Fibonacci retracements, advanced chart patterns, RSI divergence, and the Ichimoku Cloud, traders can make more informed decisions and enhance their trading performance. Combining these techniques with sound risk management practices ensures a balanced and strategic approach to investing.
Additional Resources:
Books:
"Elliott Wave Principle: Key to Market Behavior" by A.J. Frost and Robert R. Prechter
"Fibonacci Trading: How to Master the Time and Price Advantage" by Carolyn Boroden
"Japanese Candlestick Charting Techniques" by Steve Nison
Online Courses:
Coursera's "Technical Analysis and Trading Strategies"
Udemy's "Advanced Technical Analysis Strategies for Trading"
Websites and Forums:
Investopedia: Comprehensive articles on technical analysis
TradingView: Charting tools and community insights
Further Reading:
Academic journals and research papers on advanced technical analysis
Financial news outlets for the latest market trends and analysis
By leveraging these resources, retail investors can deepen their understanding of advanced technical analysis techniques and effectively incorporate them into their trading strategies.
Enjoy and be safe.